All posts tagged “infographic

infographic_consequence_buying_blender

[Infographic] Should You Buy a Blender?

When I bought my first blender I was full of hopes and dreams about it.

I thought I’d become a new, healthier man who exercises regularly and asks his friends “Is this BIO? Oh, right, it’s not, you can really taste the difference”.

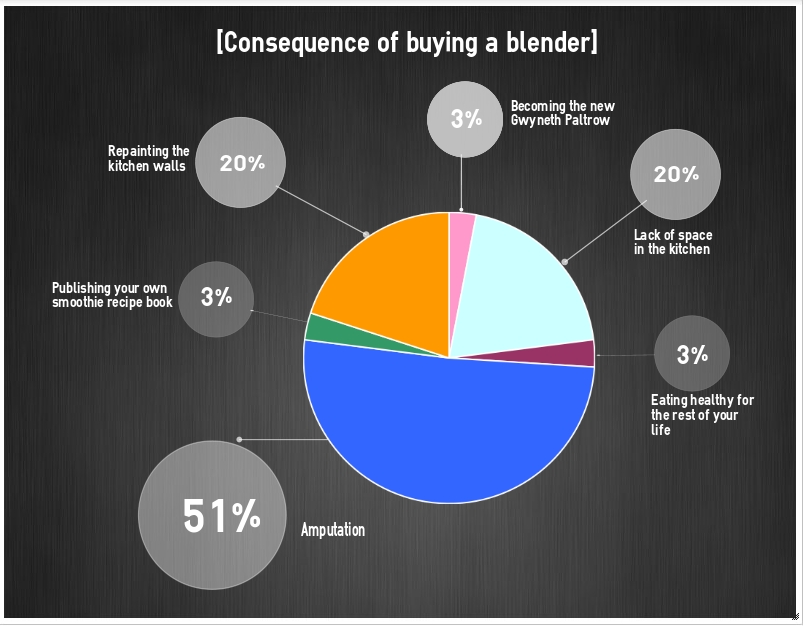
The truth turned out to be a little different than that. If you’re considering buying a blender you should be aware of the unexpected, comical, useless, disappointing consequences and this infographic is for you.

infographic_consequence_buying_blenderI made this with Easel.ly

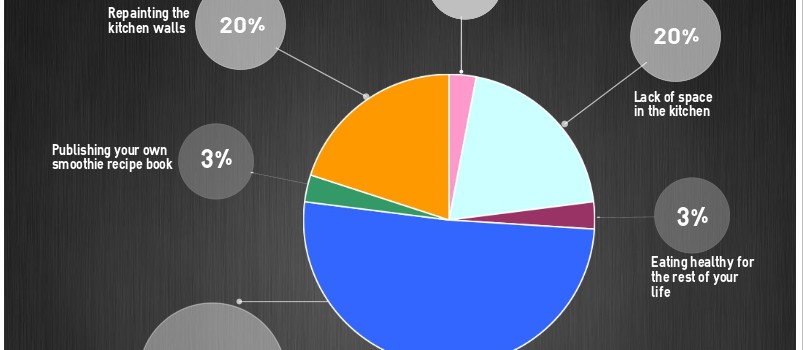
 What you want to happen


Becoming the new Gwyneth Paltrow

Read More

Infographic: Gender distribution in Social Media!

After collecting data for months I can finally publish the results of my study about gender distribution in social media. The data have been collected by looking over the shoulders of strangers in the train and going through the browser history of my colleagues while they were taking their lunch breaks. Hope you enjoy the resulting infographic.

gender distribution in social media infographic